NVIDIA 初创加速计划,免费加速您的创业启动 了解详情
写点什么

VS Code 调试太难?这款可视化代码调试工具值得拥有

  • 2020-02-27
  • 本文字数:2013 字

    阅读完需:约 7 分钟

VS Code调试太难?这款可视化代码调试工具值得拥有

这是一个在调试期间可视化数据结构的 VS Code 扩展,使用它之后,你可以清晰明了的看到不同数据之间的关系。


一个名叫 hediet 的外国程序员开源了一个在调试期间可视化数据结构的 VS Code 扩展——Debug Visualizer。


这个扩展程序可以在 VS Code 中调试任何编程语言,当然,目前最适配的编程语言是 JavaScript 和 TypeScript,另外 C#、Java 和 PHP 也进行了相应的测试。

如何安装使用?

安装此扩展后,使用命令 Open a new Debug Visualizer View 打开新的可视化器视图。在这个视图中,你可以输入一个表达式,该表达式在逐步分析你的代码时会进行评估和可视化,例如


    kind: { graph: true },    nodes: [ { id: "1", label: "1" }, { id: "2", label: "2" } ],    edges: [{ from: "1", to: "2", label: "edge" }]}
复制代码


你可以通过编写自己的函数,从自定义数据结构中提取这些调试数据。

哪些数据可被可视化呢?

很多人可能会问,这个可视化代码调试工具都支持哪些东西可视化呢?基本上你能想到的,它都可以做到可视化。
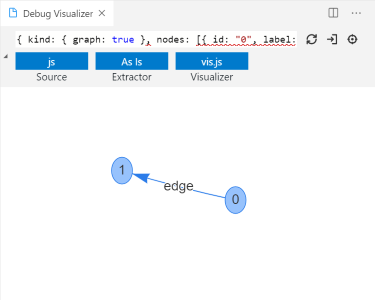
图形可视化

Graphviz 和 Vis.js 可视化工具可以渲染与 Graph 界面匹配的数据。


interface Graph {  kind: { graph: true };  nodes: NodeGraphData[];  edges: EdgeGraphData[];}
interface NodeGraphData { id: string; label?: string; color?: string; shape?: "ellipse" | "box";}
interface EdgeGraphData { from: string; to: string; label?: string; id?: string; color?: string; dashes?: boolean;}
复制代码


graphviz 可视化工具可以通过使用 SVG 查看器来查看 viz.js 创建的 SVG。
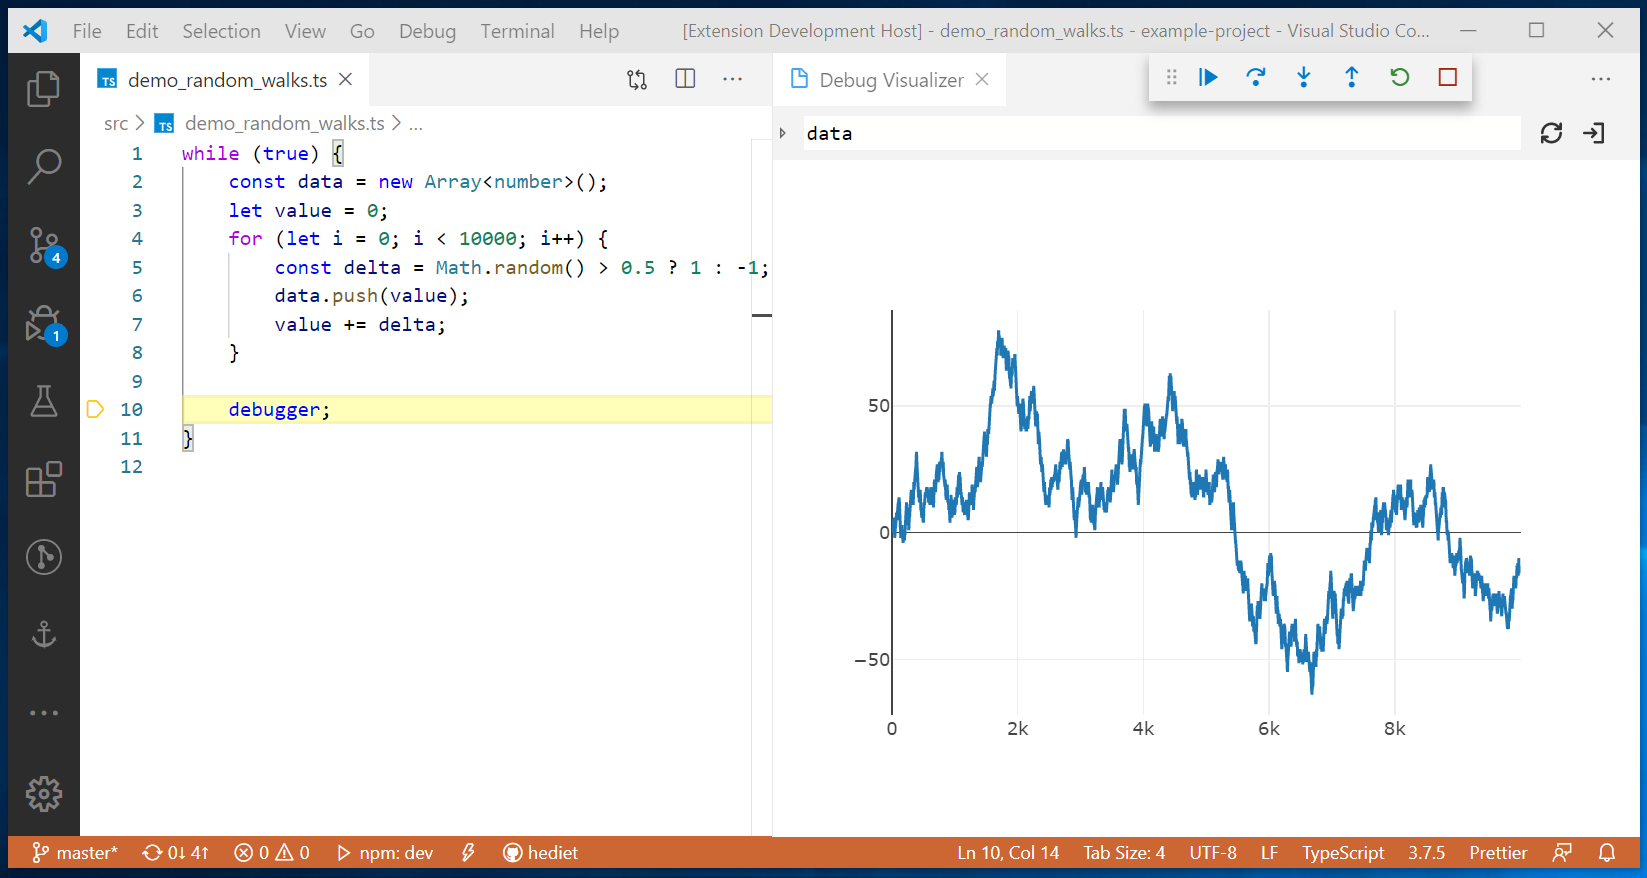

Plotly 可视化

plotly visualizer 可以通过 plotly 来渲染与界面匹配的 JSON 数据。


export interface Plotly {  kind: { plotly: true };  data: Partial<Plotly.Data>[];}// See plotly docs for Plotly.Data.

复制代码


Tree 可视化

树可视化器渲染与 Tree 接口匹配的数据。
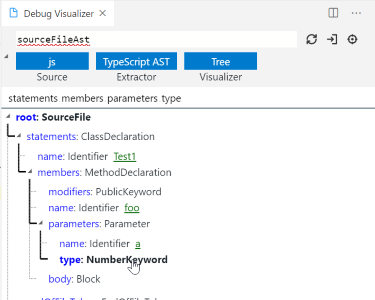
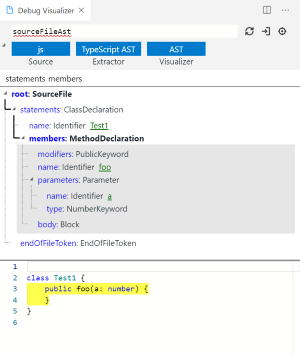

interface Tree<TData = unknown> {  kind: { tree: true };  root: TreeNode<TData>;}interface TreeNode<TExtraData> {  id: string | undefined;  name: string;  value: string | undefined;  emphasizedValue: string | undefined;  children: TreeNode<TExtraData>[];  data: TExtraData;  isMarked: boolean;}

复制代码


AST 可视化

AST 可视化工具渲染与 Ast 接口匹配的数据。


interface Ast  extends Tree<{      position: number;      length: number;    }>,    Text {  kind: { text: true; tree: true; ast: true };}
复制代码


除了树视图外,AST 可视化工具还会高亮显示源代码的来源。
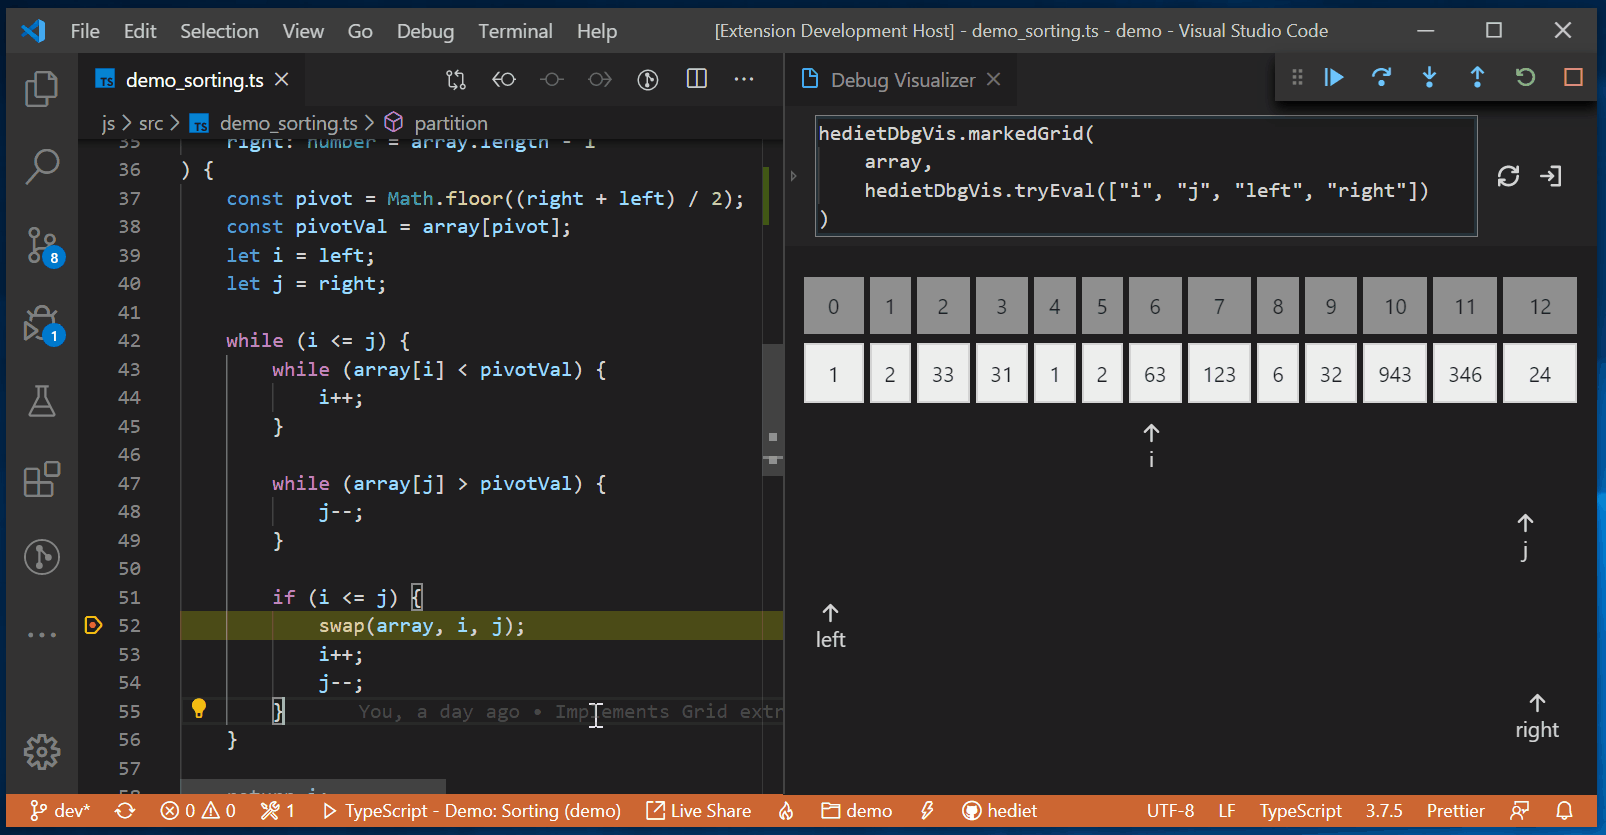

Grid 可视化

Grid 可视化工具会渲染与以下接口匹配的数据。


export interface Grid {  kind: { array: true };  columnLabels?: { label?: string }[];  rows: {    label?: string;    columns: {      content?: string;      tag?: string;      color?: string;    }[];  }[];  markers?: {    id: string;
row: number; column: number; rows?: number; columns?: number;
label?: string; color?: string; }[];}
复制代码

Text 可视化

文本可视化工具渲染与 Text 接口匹配的数据。


interface Text {  kind: { text: true };  text: string;  mimeType?: string;  fileName?: string;}
复制代码


mimeType 和 fileName 的文件扩展名用于语法高亮显示。

SVG 可视化

SVG 可视化工具渲染与 Svg 接口匹配的数据。实际的 SVG 数据必须存储在 text 中。


interface Svg extends Text {  kind: { text: true; svg: true };}
复制代码


点图可视化


点图可视化工具渲染与 DotGraph 接口匹配的数据。


interface DotGraph extends Text {  kind: { text: true; dotGraph: true };}
复制代码


Viz.js(Graphviz)用于渲染。

哪些数据可被提取?

该工具中包含有 JavaScript/TypeScript 数据提取器,数据提取器可将任意值转换为可视化数据。这个扩展会自动在被调试者中注入以下数据提取器,当然用户也可以注册自定义数据提取器。

ToString

只需对值调用 .toString() ,就可将数据转换为文本类型。

TypeScript AST

  • 直接可视化 ts.Node

  • Record 和 [ts.Node] 的可视化。如果记录包含 fn 键,则将为每个节点显示它们的值。
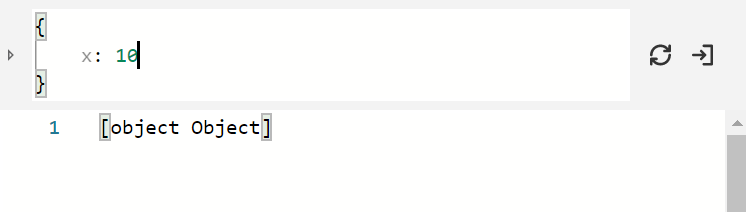
As Is 数据提取器

将数据直接输入到可视化工具。

使用方法 getDebugVisualization

调用 .getDebugVisualization(),就可将数据转换为可视化工具的直接输入。

Plotly y-Values

使用 plotly 绘制数字数组。

对象图

构造一个图形,其中包含从表达式求值到的对象可到达的所有对象。使用广度搜索构造图,在 50 个节点后停止。

Array Grid

可以为数组数据创建 Grid visualization。

其它事项

该扩展支持多行表达式,例如点击 shift+enter 可添加新行,点击 ctrl+enter 可计算表达式。当只有一行时, enter 是提交当前表达式,当有多行时,enter 插入另一个换行符。


经过该扩展程序开发者的测试,可与 TypeScript / JavaScript 库一起很好地工作。


GitHub 开源地址:


https://github.com/hediet/vscode-debug-visualizer/tree/master/extension


2020-02-27 14:553839

评论

发布
暂无评论
发现更多内容
VS Code调试太难?这款可视化代码调试工具值得拥有_语言 & 开发_hediet_InfoQ精选文章