
使用 pt-query-digest 分析 RDS MySQL 慢查询日志
- 2019-10-05
本文字数:25965 字
阅读完需:约 85 分钟

前言
本文主要讲述如何使用 pt-query-digest 工具对 RDS MySQL 的 slow log 进行分析。
关于 RDS MySQL
MySQL 是世界上最流行的开源关系数据库,而 Amazon RDS 让你能够在云中轻松设置、操作和扩展 MySQL 部署。借助 Amazon RDS ,您可以在几分钟内快速部署可扩展的 MySQL 服务器,不仅经济实惠,还可以根据需要随时调整硬件容量的大小。
Amazon RDS for MySQL 可以管理备份、软件修补、监控、扩展和复制等耗时的数据库管理任务,让你能专注于应用程序开发和提供业务竞争力。
Amazon RDS 目前支持 5.5、5.6、5.7 和 8.0 版 MySQL Community Edition。
关于 pt-query-digest
对于数据库的日常管理工作,性能管理肯定会是占比最大的一块,“工欲善其事必先利其器”,一个好的性能分析工具会极大的提高数据库性能管理的效率,而 pt-query-digest 就是专门针对 MySQL 数据库慢查询日志的一个强力分析工具,相比于 mysqldumpslow ,其分析结果更加具体和完善。
pt-query-digest 属于 Percona Toolkit 工具集中最常用的一种,号称 MySQL DBA 必备工具之一,其能够分析 MySQL 数据库的 slow log 、 general log 、 binary log 文件,同时也可以使用 show processlist 或从 tcpdump 抓取的 MySQL 协议数据来进行分析。
安装 Percona Toolkit
安装最新的 percona release package
[root@ip-172-31-36-44 ~]# yum install https://repo.percona.com/yum/percona-release-latest.noarch.rpmLoaded plugins: amazon-id, rhui-lb, search-disabled-repospercona-release-latest.noarch.rpm                                                                                                                         |  16 kB  00:00:00     Examining /var/tmp/yum-root-jxf0g4/percona-release-latest.noarch.rpm: percona-release-1.0-9.noarchMarking /var/tmp/yum-root-jxf0g4/percona-release-latest.noarch.rpm to be installedResolving Dependencies--> Running transaction check---> Package percona-release.noarch 0:1.0-9 will be installed--> Finished Dependency Resolution
Dependencies Resolved
=================================================================================================================================================================================Package                                    Arch                              Version                            Repository                                                 Size=================================================================================================================================================================================Installing:percona-release                            noarch                            1.0-9                              /percona-release-latest.noarch                             18 k
Transaction Summary=================================================================================================================================================================================Install  1 Package
Total size: 18 kInstalled size: 18 kIs this ok [y/d/N]: yDownloading packages:Running transaction checkRunning transaction testTransaction test succeededRunning transaction  Installing : percona-release-1.0-9.noarch                                                                                                                                  1/1 * Enabling the Percona Original repository<*> All done!The percona-release package now contains a percona-release script that can enable additional repositories for our newer products.
For example, to enable the Percona Server 8.0 repository use:
  percona-release setup ps80
Note: To avoid conflicts with older product versions, the percona-release setup command may disable our original repository for some products.
For more information, please visit:  https://www.percona.com/doc/percona-repo-config/percona-release.html
  Verifying  : percona-release-1.0-9.noarch                                                                                                                                  1/1
Installed:  percona-release.noarch 0:1.0-9
Complete![root@ip-172-31-36-44 ~]#

[root@ip-172-31-36-44 ~]# ls -ltr /etc/yum.repos.d/total 24-rw-r--r--. 1 root root 8679 Mar 18 03:32 redhat-rhui.repo-rw-r--r--. 1 root root   90 Mar 18 03:32 rhui-load-balancers.conf-rw-r--r--. 1 root root  607 Mar 18 03:32 redhat-rhui-client-config.repo-rw-r--r--. 1 root root  780 Mar 18 03:55 percona-original-release.repo[root@ip-172-31-36-44 ~]# [root@ip-172-31-36-44 ~]# rpm -aq|grep perconapercona-release-1.0-9.noarchpercona-toolkit-3.0.13-1.el7.x86_64[root@ip-172-31-36-44 ~]#
安装 percona toolkit
[root@ip-172-31-36-44 ~]# yum install percona-toolkitLoaded plugins: amazon-id, rhui-lb, search-disabled-reposResolving Dependencies--> Running transaction check---> Package percona-toolkit.x86_64 0:3.0.13-1.el7 will be installed--> Processing Dependency: perl(DBI) >= 1.13 for package: percona-toolkit-3.0.13-1.el7.x86_64--> Processing Dependency: perl(DBD::mysql) >= 1.0 for package: percona-toolkit-3.0.13-1.el7.x86_64--> Processing Dependency: perl(IO::Socket::SSL) for package: percona-toolkit-3.0.13-1.el7.x86_64--> Processing Dependency: perl(Digest::MD5) for package: percona-toolkit-3.0.13-1.el7.x86_64--> Processing Dependency: perl(Term::ReadKey) for package: percona-toolkit-3.0.13-1.el7.x86_64--> Running transaction check---> Package perl-DBD-MySQL.x86_64 0:4.023-6.el7 will be installed---> Package perl-DBI.x86_64 0:1.627-4.el7 will be installed--> Processing Dependency: perl(RPC::PlClient) >= 0.2000 for package: perl-DBI-1.627-4.el7.x86_64--> Processing Dependency: perl(RPC::PlServer) >= 0.2001 for package: perl-DBI-1.627-4.el7.x86_64--> Processing Dependency: perl(Data::Dumper) for package: perl-DBI-1.627-4.el7.x86_64---> Package perl-Digest-MD5.x86_64 0:2.52-3.el7 will be installed--> Processing Dependency: perl(Digest::base) >= 1.00 for package: perl-Digest-MD5-2.52-3.el7.x86_64---> Package perl-IO-Socket-SSL.noarch 0:1.94-7.el7 will be installed--> Processing Dependency: perl(IO::Socket::IP) >= 0.20 for package: perl-IO-Socket-SSL-1.94-7.el7.noarch--> Processing Dependency: perl(Net::SSLeay) >= 1.21 for package: perl-IO-Socket-SSL-1.94-7.el7.noarch--> Processing Dependency: perl-Net-SSLeay >= 1.55-5 for package: perl-IO-Socket-SSL-1.94-7.el7.noarch--> Processing Dependency: perl(Mozilla::CA) for package: perl-IO-Socket-SSL-1.94-7.el7.noarch--> Processing Dependency: perl(Net::LibIDN) for package: perl-IO-Socket-SSL-1.94-7.el7.noarch--> Processing Dependency: perl(Net::SSLeay) for package: perl-IO-Socket-SSL-1.94-7.el7.noarch---> Package perl-TermReadKey.x86_64 0:2.30-20.el7 will be installed--> Running transaction check---> Package perl-Data-Dumper.x86_64 0:2.145-3.el7 will be installed---> Package perl-Digest.noarch 0:1.17-245.el7 will be installed---> Package perl-IO-Socket-IP.noarch 0:0.21-5.el7 will be installed---> Package perl-Mozilla-CA.noarch 0:20130114-5.el7 will be installed---> Package perl-Net-LibIDN.x86_64 0:0.12-15.el7 will be installed---> Package perl-Net-SSLeay.x86_64 0:1.55-6.el7 will be installed---> Package perl-PlRPC.noarch 0:0.2020-14.el7 will be installed--> Processing Dependency: perl(Net::Daemon) >= 0.13 for package: perl-PlRPC-0.2020-14.el7.noarch--> Processing Dependency: perl(Compress::Zlib) for package: perl-PlRPC-0.2020-14.el7.noarch--> Processing Dependency: perl(Net::Daemon::Log) for package: perl-PlRPC-0.2020-14.el7.noarch--> Processing Dependency: perl(Net::Daemon::Test) for package: perl-PlRPC-0.2020-14.el7.noarch--> Running transaction check---> Package perl-IO-Compress.noarch 0:2.061-2.el7 will be installed--> Processing Dependency: perl(Compress::Raw::Bzip2) >= 2.061 for package: perl-IO-Compress-2.061-2.el7.noarch--> Processing Dependency: perl(Compress::Raw::Zlib) >= 2.061 for package: perl-IO-Compress-2.061-2.el7.noarch---> Package perl-Net-Daemon.noarch 0:0.48-5.el7 will be installed--> Running transaction check---> Package perl-Compress-Raw-Bzip2.x86_64 0:2.061-3.el7 will be installed---> Package perl-Compress-Raw-Zlib.x86_64 1:2.061-4.el7 will be installed--> Finished Dependency Resolution
Dependencies Resolved
=================================================================================================================================================================================Package Arch Version Repository Size=================================================================================================================================================================================Installing:percona-toolkit x86_64 3.0.13-1.el7 percona-release-x86_64 7.4 MInstalling for dependencies:perl-Compress-Raw-Bzip2 x86_64 2.061-3.el7 rhui-REGION-rhel-server-releases 32 kperl-Compress-Raw-Zlib x86_64 1:2.061-4.el7 rhui-REGION-rhel-server-releases 57 kperl-DBD-MySQL x86_64 4.023-6.el7 rhui-REGION-rhel-server-releases 140 kperl-DBI x86_64 1.627-4.el7 rhui-REGION-rhel-server-releases 802 kperl-Data-Dumper x86_64 2.145-3.el7 rhui-REGION-rhel-server-releases 47 kperl-Digest noarch 1.17-245.el7 rhui-REGION-rhel-server-releases 23 kperl-Digest-MD5 x86_64 2.52-3.el7 rhui-REGION-rhel-server-releases 30 kperl-IO-Compress noarch 2.061-2.el7 rhui-REGION-rhel-server-releases 260 kperl-IO-Socket-IP noarch 0.21-5.el7 rhui-REGION-rhel-server-releases 36 kperl-IO-Socket-SSL noarch 1.94-7.el7 rhui-REGION-rhel-server-releases 114 kperl-Mozilla-CA noarch 20130114-5.el7 rhui-REGION-rhel-server-releases 11 kperl-Net-Daemon noarch 0.48-5.el7 rhui-REGION-rhel-server-releases 51 kperl-Net-LibIDN x86_64 0.12-15.el7 rhui-REGION-rhel-server-releases 28 kperl-Net-SSLeay x86_64 1.55-6.el7 rhui-REGION-rhel-server-releases 286 kperl-PlRPC noarch 0.2020-14.el7 rhui-REGION-rhel-server-releases 36 kperl-TermReadKey x86_64 2.30-20.el7 rhui-REGION-rhel-server-releases 31 kTransaction Summary=================================================================================================================================================================================Install 1 Package (+16 Dependent packages)
Total download size: 9.4 MInstalled size: 12 MIs this ok [y/d/N]: yDownloading packages:(1/17): perl-Compress-Raw-Bzip2-2.061-3.el7.x86_64.rpm | 32 kB 00:00:00 (2/17): perl-Compress-Raw-Zlib-2.061-4.el7.x86_64.rpm | 57 kB 00:00:00 (3/17): perl-DBD-MySQL-4.023-6.el7.x86_64.rpm | 140 kB 00:00:00 (4/17): perl-Data-Dumper-2.145-3.el7.x86_64.rpm | 47 kB 00:00:00 (5/17): perl-DBI-1.627-4.el7.x86_64.rpm | 802 kB 00:00:00 (6/17): perl-Digest-1.17-245.el7.noarch.rpm | 23 kB 00:00:00 (7/17): perl-Digest-MD5-2.52-3.el7.x86_64.rpm | 30 kB 00:00:00 (8/17): perl-IO-Compress-2.061-2.el7.noarch.rpm | 260 kB 00:00:00 (9/17): perl-IO-Socket-IP-0.21-5.el7.noarch.rpm | 36 kB 00:00:00 (10/17): perl-IO-Socket-SSL-1.94-7.el7.noarch.rpm | 114 kB 00:00:00 (11/17): perl-Mozilla-CA-20130114-5.el7.noarch.rpm | 11 kB 00:00:00 (12/17): perl-Net-Daemon-0.48-5.el7.noarch.rpm | 51 kB 00:00:00 (13/17): perl-Net-LibIDN-0.12-15.el7.x86_64.rpm | 28 kB 00:00:00 (14/17): perl-PlRPC-0.2020-14.el7.noarch.rpm | 36 kB 00:00:00 (15/17): perl-Net-SSLeay-1.55-6.el7.x86_64.rpm | 286 kB 00:00:00 (16/17): perl-TermReadKey-2.30-20.el7.x86_64.rpm | 31 kB 00:00:00 (17/17): percona-toolkit-3.0.13-1.el7.x86_64.rpm | 7.4 MB 00:00:03 ---------------------------------------------------------------------------------------------------------------------------------------------------------------------------------Total 2.4 MB/s | 9.4 MB 00:00:03 Running transaction checkRunning transaction testTransaction test succeededRunning transaction Installing : perl-Digest-1.17-245.el7.noarch 1/17 Installing : perl-Digest-MD5-2.52-3.el7.x86_64 2/17 Installing : perl-Compress-Raw-Bzip2-2.061-3.el7.x86_64 3/17 Installing : perl-Net-LibIDN-0.12-15.el7.x86_64 4/17 Installing : 1:perl-Compress-Raw-Zlib-2.061-4.el7.x86_64 5/17 Installing : perl-IO-Compress-2.061-2.el7.noarch 6/17 Installing : perl-Net-SSLeay-1.55-6.el7.x86_64 7/17 Installing : perl-IO-Socket-IP-0.21-5.el7.noarch 8/17 Installing : perl-Data-Dumper-2.145-3.el7.x86_64 9/17 Installing : perl-TermReadKey-2.30-20.el7.x86_64 10/17 Installing : perl-Net-Daemon-0.48-5.el7.noarch 11/17 Installing : perl-PlRPC-0.2020-14.el7.noarch 12/17 Installing : perl-DBI-1.627-4.el7.x86_64 13/17 Installing : perl-DBD-MySQL-4.023-6.el7.x86_64 14/17 Installing : perl-Mozilla-CA-20130114-5.el7.noarch 15/17 Installing : perl-IO-Socket-SSL-1.94-7.el7.noarch 16/17 Installing : percona-toolkit-3.0.13-1.el7.x86_64 17/17 Verifying : perl-Mozilla-CA-20130114-5.el7.noarch 1/17 Verifying : perl-Net-Daemon-0.48-5.el7.noarch 2/17 Verifying : perl-TermReadKey-2.30-20.el7.x86_64 3/17 Verifying : perl-Data-Dumper-2.145-3.el7.x86_64 4/17 Verifying : perl-Digest-MD5-2.52-3.el7.x86_64 5/17 Verifying : perl-IO-Socket-IP-0.21-5.el7.noarch 6/17 Verifying : percona-toolkit-3.0.13-1.el7.x86_64 7/17 Verifying : perl-DBD-MySQL-4.023-6.el7.x86_64 8/17 Verifying : perl-PlRPC-0.2020-14.el7.noarch 9/17 Verifying : perl-Net-SSLeay-1.55-6.el7.x86_64 10/17 Verifying : 1:perl-Compress-Raw-Zlib-2.061-4.el7.x86_64 11/17 Verifying : perl-Net-LibIDN-0.12-15.el7.x86_64 12/17 Verifying : perl-Compress-Raw-Bzip2-2.061-3.el7.x86_64 13/17 Verifying : perl-Digest-1.17-245.el7.noarch 14/17 Verifying : perl-DBI-1.627-4.el7.x86_64 15/17 Verifying : perl-IO-Compress-2.061-2.el7.noarch 16/17 Verifying : perl-IO-Socket-SSL-1.94-7.el7.noarch 17/17
Installed: percona-toolkit.x86_64 0:3.0.13-1.el7
Dependency Installed: perl-Compress-Raw-Bzip2.x86_64 0:2.061-3.el7 perl-Compress-Raw-Zlib.x86_64 1:2.061-4.el7 perl-DBD-MySQL.x86_64 0:4.023-6.el7 perl-DBI.x86_64 0:1.627-4.el7 perl-Data-Dumper.x86_64 0:2.145-3.el7 perl-Digest.noarch 0:1.17-245.el7 perl-Digest-MD5.x86_64 0:2.52-3.el7 perl-IO-Compress.noarch 0:2.061-2.el7 perl-IO-Socket-IP.noarch 0:0.21-5.el7 perl-IO-Socket-SSL.noarch 0:1.94-7.el7 perl-Mozilla-CA.noarch 0:20130114-5.el7 perl-Net-Daemon.noarch 0:0.48-5.el7 perl-Net-LibIDN.x86_64 0:0.12-15.el7 perl-Net-SSLeay.x86_64 0:1.55-6.el7 perl-PlRPC.noarch 0:0.2020-14.el7 perl-TermReadKey.x86_64 0:2.30-20.el7
Complete![root@ip-172-31-36-44 ~]#
验证 pt-queyr-digest 是否可以使用
[root@ip-172-31-36-44 ~]# pt-query-digest --helppt-query-digest analyzes MySQL queries from slow, general, and binary log files.It can also analyze queries from C<SHOW PROCESSLIST> and MySQL protocol datafrom tcpdump.  By default, queries are grouped by fingerprint and reported indescending order of query time (i.e. the slowest queries first).  If no C<FILES>are given, the tool reads C<STDIN>.  The optional C<DSN> is used for certainoptions like L<"--since"> and L<"--until">.  For more details, please use the--help option, or try 'perldoc /bin/pt-query-digest' for complete documentation.
Usage: pt-query-digest [OPTIONS] [FILES] [DSN]
Options:
  --ask-pass                   Prompt for a password when connecting to MySQL  --attribute-aliases=a        List of attribute|alias,etc (default db|Schema)  --attribute-value-limit=i    A sanity limit for attribute values (default 0)  --charset=s              -A  Default character set  --config=A                   Read this comma-separated list of config files;                               if specified, this must be the first option on                               the command line  --[no]continue-on-error      Continue parsing even if there is an error (                               default yes)  --[no]create-history-table   Create the --history table if it does not exist (                               default yes)  --[no]create-review-table    Create the --review table if it does not exist (                               default yes)  --daemonize                  Fork to the background and detach from the shell  --database=s             -D  Connect to this database  --defaults-file=s        -F  Only read mysql options from the given file  --embedded-attributes=a      Two Perl regex patterns to capture pseudo-                               attributes embedded in queries  --expected-range=a           Explain items when there are more or fewer than                               expected (default 5,10)  --explain=d                  Run EXPLAIN for the sample query with this DSN                               and print results  --filter=s                   Discard events for which this Perl code doesn't                               return true  --group-by=A                 Which attribute of the events to group by (                               default fingerprint)  --help                       Show help and exit  --history=d                  Save metrics for each query class in the given                               table. pt-query-digest saves query metrics (                               query time, lock time, etc.) to this table so                               you can see how query classes change over time  --host=s                 -h  Connect to host  --ignore-attributes=a        Do not aggregate these attributes (default arg,                               cmd, insert_id, ip, port, Thread_id, timestamp,                               exptime, flags, key, res, val, server_id,                               offset, end_log_pos, Xid)  --inherit-attributes=a       If missing, inherit these attributes from the                               last event that had them (default db,ts)  --interval=f                 How frequently to poll the processlist, in                               seconds (default .1)  --iterations=i               How many times to iterate through the collect-                               and-report cycle (default 1)  --limit=A                    Limit output to the given percentage or count (                               default 95%:20)  --log=s                      Print all output to this file when daemonized  --max-hostname-length=i      Trim host names in reports to this length. 0=Do                               not trim host names (default 10)  --max-line-length=i          Trim lines to this length. 0=Do not trim lines (                               default 74)  --order-by=A                 Sort events by this attribute and aggregate                               function (default Query_time:sum)  --outliers=a                 Report outliers by attribute:percentile:count (                               default Query_time:1:10)  --output=s                   How to format and print the query analysis                               results (default report)  --password=s             -p  Password to use when connecting  --pid=s                      Create the given PID file  --port=i                 -P  Port number to use for connection  --preserve-embedded-numbers  Preserve numbers in database/table names when                               fingerprinting queries  --processlist=d              Poll this DSN's processlist for queries, with --                               interval sleep between  --progress=a                 Print progress reports to STDERR (default time,                               30)  --read-timeout=m             Wait this long for an event from the input; 0 to                               wait forever (default 0).  Optional suffix s=                               seconds, m=minutes, h=hours, d=days; if no                               suffix, s is used.  --[no]report                 Print query analysis reports for each --group-by                               attribute (default yes)  --report-all                 Report all queries, even ones that have been                               reviewed  --report-format=A            Print these sections of the query analysis                               report (default rusage,date,hostname,files,                               header,profile,query_report,prepared)  --report-histogram=s         Chart the distribution of this attribute's                               values (default Query_time)  --resume=s                   If specified, the tool writes the last file                               offset, if there is one, to the given filename  --review=d                   Save query classes for later review, and don't                               report already reviewed classes  --run-time=m                 How long to run for each --iterations.  Optional                               suffix s=seconds, m=minutes, h=hours, d=days; if                               no suffix, s is used.  --run-time-mode=s            Set what the value of --run-time operates on (                               default clock)  --sample=i                   Filter out all but the first N occurrences of                               each query  --set-vars=A                 Set the MySQL variables in this comma-separated                               list of variable=value pairs  --show-all=H                 Show all values for these attributes  --since=s                    Parse only queries newer than this value (parse                               queries since this date)  --slave-password=s           Sets the password to be used to connect to the                               slaves  --slave-user=s               Sets the user to be used to connect to the slaves  --socket=s               -S  Socket file to use for connection  --timeline                   Show a timeline of events  --type=A                     The type of input to parse (default slowlog)  --until=s                    Parse only queries older than this value (parse                               queries until this date)  --user=s                 -u  User for login if not current user  --variations=A               Report the number of variations in these                               attributes' values  --version                    Show version and exit  --[no]version-check          Check for the latest version of Percona Toolkit,                               MySQL, and other programs (default yes)  --[no]vertical-format        Output a trailing "\G" in the reported SQL                               queries (default yes)  --watch-server=s             This option tells pt-query-digest which server                               IP address and port (like "10.0.0.1:3306") to                               watch when parsing tcpdump (for --type tcpdump);                               all other servers are ignored
Option types: s=string, i=integer, f=float, h/H/a/A=comma-separated list, d=DSN, z=size, m=time
Rules:
  This tool accepts additional command-line arguments. Refer to the SYNOPSIS and usage information for details.
DSN syntax is key=value[,key=value...]  Allowable DSN keys:
  KEY  COPY  MEANING  ===  ====  =============================================  A    yes   Default character set  D    yes   Default database to use when connecting to MySQL  F    yes   Only read default options from the given file  P    yes   Port number to use for connection  S    yes   Socket file to use for connection  h    yes   Connect to host  p    yes   Password to use when connecting  t    no    The --review or --history table  u    yes   User for login if not current user
  If the DSN is a bareword, the word is treated as the 'h' key.
Options and values after processing arguments:
  --ask-pass                   FALSE  --attribute-aliases          db|Schema  --attribute-value-limit      0  --charset                    (No value)  --config                     /etc/percona-toolkit/percona-toolkit.conf,/etc/percona-toolkit/pt-query-digest.conf,/root/.percona-toolkit.conf,/root/.pt-query-digest.conf  --continue-on-error          TRUE  --create-history-table       TRUE  --create-review-table        TRUE  --daemonize                  FALSE  --database                   (No value)  --defaults-file              (No value)  --embedded-attributes        (No value)  --expected-range             5,10  --explain                    (No value)  --filter                     (No value)  --group-by                   fingerprint  --help                       TRUE  --history                    (No value)  --host                       (No value)  --ignore-attributes          arg,cmd,insert_id,ip,port,Thread_id,timestamp,exptime,flags,key,res,val,server_id,offset,end_log_pos,Xid  --inherit-attributes         db,ts  --interval                   .1  --iterations                 1  --limit                      95%:20  --log                        (No value)  --max-hostname-length        10  --max-line-length            74  --order-by                   Query_time:sum  --outliers                   Query_time:1:10  --output                     report  --password                   (No value)  --pid                        (No value)  --port                       (No value)  --preserve-embedded-numbers  FALSE  --processlist                (No value)  --progress                   time,30  --read-timeout               0  --report                     TRUE  --report-all                 FALSE  --report-format              rusage,date,hostname,files,header,profile,query_report,prepared  --report-histogram           Query_time  --resume                     (No value)  --review                     (No value)  --run-time                   (No value)  --run-time-mode              clock  --sample                     (No value)  --set-vars                     --show-all                     --since                      (No value)  --slave-password             (No value)  --slave-user                 (No value)  --socket                     (No value)  --timeline                   FALSE  --type                       slowlog  --until                      (No value)  --user                       (No value)  --variations                   --version                    FALSE  --version-check              TRUE  --vertical-format            TRUE  --watch-server               (No value)[root@ip-172-31-36-44 ~]#
安装及配置 AWSCLI
这里安装 awscli 主要是为了后续可以使用 awscli 下载 RDS MySQL 的 slow log 文件到本地,供 pt-query-digest 进行分析。
安装 awscli
curl "https://s3.amazonaws.com/aws-cli/awscli-bundle.zip" -o "awscli-bundle.zip"unzip awscli-bundle.zip./awscli-bundle/installecho "export PATH=$PATH:/root/.local/lib/aws/bin" >> ~/.bash_profilesource ~/.bash_profilecat ~/.bash_profile
配置 awscli
[root@ip-172-31-36-44 ~]# aws configureAWS Access Key ID [None]: AKIAXXXXXXXX6PPVDJKQAWS Secret Access Key [None]: BhlGgQLOjEcxxxxx/w3JxxxxxxUCI4IAra92ZJDefault region name [None]: cn-northwest-1Default output format [None]: [root@ip-172-31-36-44 ~]#
安装 MySQL 客户端
这里安装 MySQL 客户端主要是为了后续可以使用 mysql 命令进行相关 sql 语句的执行,以获取 RDS MySQL 的 slow log 文件到本地,供 pt-query-digest 进行分析。
[root@ip-172-31-36-44 ~]# yum install mariadb.x86_64 -yLoaded plugins: amazon-id, rhui-lb, search-disabled-reposResolving Dependencies--> Running transaction check---> Package mariadb.x86_64 1:5.5.60-1.el7_5 will be installed--> Finished Dependency Resolution
Dependencies Resolved
=================================================================================================================================================================================Package                           Arch                             Version                                     Repository                                                  Size=================================================================================================================================================================================Installing:mariadb                           x86_64                           1:5.5.60-1.el7_5                            rhui-REGION-rhel-server-releases                           8.6 M
Transaction Summary=================================================================================================================================================================================Install  1 Package
Total download size: 8.6 MInstalled size: 49 MDownloading packages:mariadb-5.5.60-1.el7_5.x86_64.rpm                                                                                                                         | 8.6 MB  00:00:00     Running transaction checkRunning transaction testTransaction test succeededRunning transaction  Installing : 1:mariadb-5.5.60-1.el7_5.x86_64                                                                                                                               1/1   Verifying  : 1:mariadb-5.5.60-1.el7_5.x86_64                                                                                                                               1/1
Installed:  mariadb.x86_64 1:5.5.60-1.el7_5
Complete![root@ip-172-31-36-44 ~]#
使用 pt-query-digest 分析 slow log
前面我们已经完成了所有的准备工作,现在看看如何来使用 pt-query-digest 工具分析 RDS MySQL 的 slow log 文件。
如果要分析 slow log,第一步就是先要获取到 slow log 文件,由于 RDS MySQL 是托管数据库,我们无法登录到 MySQL 所在服务器,那么应该如何来获取 slow log 文件呢?
根据 MySQL slow log 的相关配置,我们知道 slow log 的存在形式一共有两种: table 或 file ,由 log_output 参数进行控制:
TABLE (默认) – 将一般查询写入 general_log 表,将慢速查询写入 mysql.slow_log 表;
FILE – 将一般查询日志和慢速查询日志写入文件系统;
NONE – 禁用日志记录;
针对不同形式的 slow log,我们有不同的方法将其下载到本地:
TABLE :由于这是将慢查询记录存放在 MySQL 的数据表里,这里我们可以使用 sql 命令将其输出到本地的一个文件;
FILE :慢查询日志存放在 RDS MySQL 托管主机上,我们可以利用 awscli 提供的 RDS API download-db-log-file-portion 将 slow log 下载到本地;
具体实现形式请参加后续对应部分的内容。
使用 sql 脚本获取 slow log
获取整个 slow log
mysql> show variables like 'log_output';+---------------+-------+| Variable_name | Value |+---------------+-------+| log_output | TABLE |+---------------+-------+1 row in set (0.03 sec)mysql>[root@ip-172-31-36-44 ~]# mysql -h mysql.xxxxxxxxxxxx.rds.cn-northwest-1.amazonaws.com.cn -u root -p -P13306 -D mysql -s -r -e "SELECT CONCAT( '# Time: ', DATE_FORMAT(start_time, '%y%m%d %H%i%s'), '\n', '# User@Host: ', user_host, '\n', '# Query_time: ', TIME_TO_SEC(query_time), ' Lock_time: ', TIME_TO_SEC(lock_time), ' Rows_sent: ', rows_sent, ' Rows_examined: ', rows_examined, '\n', sql_text, ';' ) FROM mysql.slow_log" > /tmp/mysql_slow_log.logEnter password: [root@ip-172-31-36-44 ~]# [root@ip-172-31-36-44 ~]# ls -l /tmp/mysql_slow_log.log-rw-r--r--. 1 root root 14211651 Mar 19 02:57 /tmp/mysql_slow_log.log[root@ip-172-31-36-44 ~]#[root@ip-172-31-36-44 ~]# more /tmp/mysql_slow_log.log# Time: 190130 145734# User@Host: root[root] @ [60.223.227.126]# Query_time: 20 Lock_time: 0 Rows_sent: 0 Rows_examined: 48413563select * from unit_value where FT121_SET <> nullLIMIT 0, 10000;# Time: 190130 153530# User@Host: root[root] @ 42-2-128-026.static.netvigator.com [42.2.128.26]# Query_time: 96 Lock_time: 0 Rows_sent: 20099504 Rows_examined: 68517265select PT111_VALUE from unit_value WHERE PT111_VALUE <> 0 and PT111_VALUE < 1.3 ORDER by UNITNAME DESC;# Time: 190130 153802# User@Host: root[root] @ 42-2-128-026.static.netvigator.com [42.2.128.26]# Query_time: 31 Lock_time: 0 Rows_sent: 579105 Rows_examined: 49576551select DISTINCT UNITNAME,PT111_VALUE from unit_value WHERE PT111_VALUE <> 0 and PT111_VALUE < 1.3 ORDER by UNITNAME DESC;# Time: 190130 154215# User@Host: root[root] @ [60.223.227.126]# Query_time: 45 Lock_time: 0 Rows_sent: 1580250 Rows_examined: 50026401select UNITNAME,first_value(PT111_VALUE) over (partition by UNITNAME order by UNITTIME)from unit_value;
获取指定时间段的 slow log
[root@ip-172-31-36-44 ~]# mysql -h mysql.xxxxxxxxxxxx.rds.cn-northwest-1.amazonaws.com.cn -u root -p -P13306 -D mysql -s -r -e "SELECT CONCAT( '# Time: ', DATE_FORMAT(start_time, '%y%m%d %H%i%s'), '\n', '# User@Host: ', user_host, '\n', '# Query_time: ', TIME_TO_SEC(query_time), ' Lock_time: ', TIME_TO_SEC(lock_time), ' Rows_sent: ', rows_sent, ' Rows_examined: ', rows_examined, '\n', sql_text, ';' ) FROM mysql.slow_log where DATE_FORMAT(start_time, '%Y%m%d %H:%i:%s') between '20190328 10:00:00' and '20190328 11:00:00' " > /tmp/slow.log.10-11.logEnter password: [root@ip-172-31-36-44 ~]#[root@ip-172-31-36-44 ~]# ls -l /tmp/mysql_slow_log1.log-rw-r--r--. 1 root root 10874816 Mar 19 04:33 /tmp/mysql_slow_log1.log[root@ip-172-31-36-44 ~]#
使用 awscli 获取 MySQL slow log
mysql> show variables like '%output%';+----------------------------+-------+| Variable_name              | Value |+----------------------------+-------+| innodb_status_output       | OFF   || innodb_status_output_locks | OFF   || log_output                 | FILE  |+----------------------------+-------+3 rows in set (0.05 sec)
mysql> mysql> show variables like '%slow%';+---------------------------+----------------------------------------------+| Variable_name             | Value                                        |+---------------------------+----------------------------------------------+| log_slow_admin_statements | OFF                                          || log_slow_slave_statements | OFF                                          || slow_launch_time          | 2                                            || slow_query_log            | ON                                           || slow_query_log_file       | /rdsdbdata/log/slowquery/mysql-slowquery.log |+---------------------------+----------------------------------------------+5 rows in set (2.07 sec)
mysql>

[root@ip-172-31-36-44 ~]# aws rds download-db-log-file-portion --db-instance-identifier mysql --log-file-name slowquery/mysql-slowquery.log --starting-token 0 --output text> mysql-slowquery.log[root@ip-172-31-36-44 ~]# ls -l mysql-slowquery.log -rw-r--r--. 1 root root 15970 Mar 19 04:41 mysql-slowquery.log[root@ip-172-31-36-44 ~]#
[root@ip-172-31-36-44 ~]# more mysql-slowquery.log# Time: 2019-03-19T04:40:56.629552Z# User@Host: root[root] @ ec2-52-82-53-253.cn-northwest-1.compute.amazonaws.com.cn [52.82.53.253]  Id: 249635335# Query_time: 5.087165  Lock_time: 0.000052 Rows_sent: 0  Rows_examined: 1496709use yuci;SET timestamp=1552970456;SELECT tagout_value.tagtime AS tagout_value_tagtime, tagout_value.tagname AS tagout_value_tagname, tagout_value.tagvalue AS tagout_value_tagvalue FROM tagout_value WHERE tagout_value.tagname = 'COV122_OUTPAR_134' ORDER BY tagout_value.tagtime DESC LIMIT 1;# Time: 2019-03-19T04:40:56.819594Z# User@Host: root[root] @ ec2-52-82-59-190.cn-northwest-1.compute.amazonaws.com.cn [52.82.59.190]  Id: 249635331# Query_time: 5.274261  Lock_time: 0.000053 Rows_sent: 0  Rows_examined: 1496709SET timestamp=1552970456;SELECT tagout_value.tagtime AS tagout_value_tagtime, tagout_value.tagname AS tagout_value_tagname, tagout_value.tagvalue AS tagout_value_tagvalue FROM tagout_value WHERE tagout_value.tagname = 'COV122_OUTPAR' ORDER BY tagout_value.tagtime DESC LIMIT 1;
实际案例
这里描述一个实际的案例,在 RDS MySQL 碰到性能问题时,我们如何通过 pt-query-digest 工具来分析性能,找到其中的问题所在。
发现问题
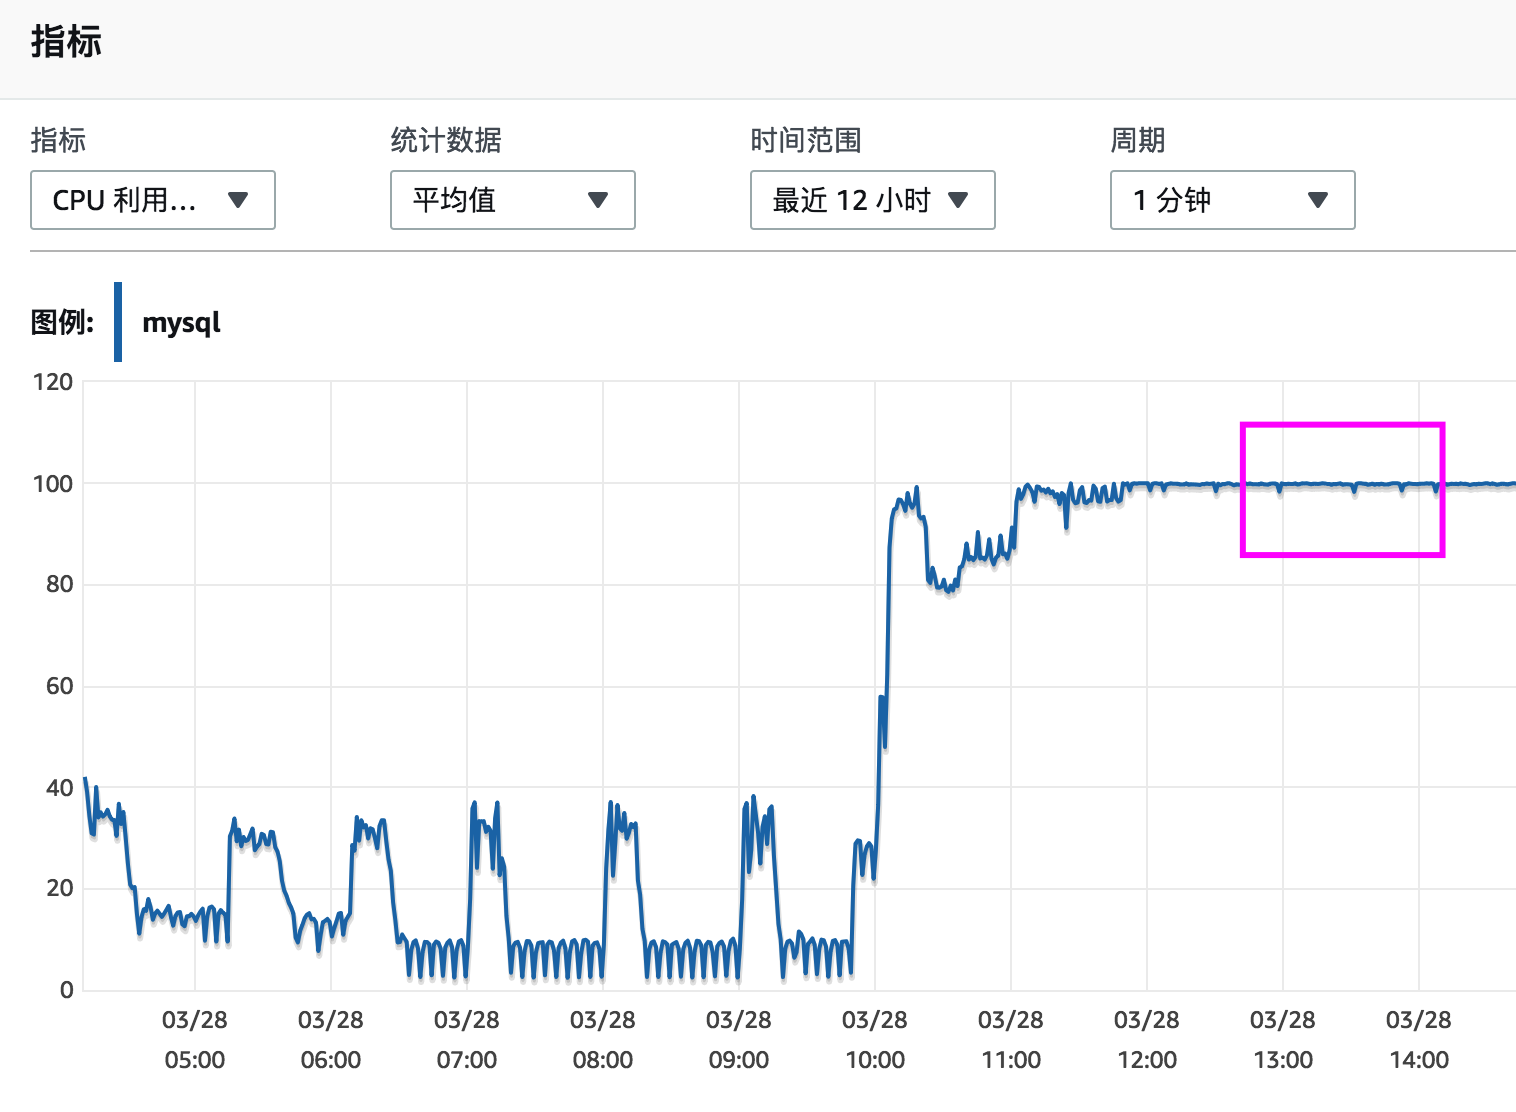
某一天突然发现 RDS MySQL CPU 利用率高达 100%,平时正常运行几乎都在 40%以下,怀疑 MySQL 数据库之前运行了一些问题 SQL 语句导致了 CPU 资源的飙升。
分析问题
这里我们首先来获取 13:00-14:00 这一个小时范围内的 RDS MySQL slow log ,然后再使用我们前面部署的 pt-query-digest 工具来分析一下,看是否可以发现一些端倪。
[root@ip-172-31-36-44 ~]# mysql -h mysql. xxxxxxxxxxxx.rds.cn-northwest-1.amazonaws.com.cn -u root -p -P13306 -D mysql -s -r -e "SELECT CONCAT( '# Time: ', DATE_FORMAT(start_time, '%y%m%d %H%i%s'), '\n', '# User@Host: ', user_host, '\n', '# Query_time: ', TIME_TO_SEC(query_time),  '  Lock_time: ', TIME_TO_SEC(lock_time), '  Rows_sent: ', rows_sent, '  Rows_examined: ', rows_examined, '\n', sql_text, ';' ) FROM mysql.slow_log where DATE_FORMAT(start_time, '%Y%m%d %H:%i:%s') between '20190328 13:00:00' and '20190328 14:00:00' " > /tmp/slow.log.1314.logEnter password: [root@ip-172-31-36-44 ~]# [root@ip-172-31-36-44 ~]# [root@ip-172-31-36-44 ~]# pt-query-digest --report /tmp/slow.log.1314.log> /tmp/report.1314.log[root@ip-172-31-36-44 ~]# [root@ip-172-31-36-44 ~]# cat /tmp/report.1314.log
# 220ms user time, 30ms system time, 27.48M rss, 221.73M vsz# Current date: Thu Mar 28 06:03:53 2019# Hostname: ip-172-31-36-44.cn-northwest-1.compute.internal# Files: /tmp/slow.log.1314.log# Overall: 255 total, 4 unique, 0 QPS, 0x concurrency ____________________# Attribute          total     min     max     avg     95%  stddev  median# ============     ======= ======= ======= ======= ======= ======= =======# Exec time          9360s      5s     62s     37s     49s      8s     35s# Lock time              0       0       0       0       0       0       0# Rows sent          3.12k       0     266   12.52       0   54.70       0# Rows examine       1.85G   1.88M  12.99M   7.45M   9.30M   1.35M   6.94M# Query size         2.42M      78 114.10k   9.72k  79.83k  28.60k  212.52# Time              46.29M 185.87k 185.87k 185.87k 185.87k       0 185.87k
# Profile# Rank Query ID                       Response time   Calls R/Call  V/M   # ==== ============================== =============== ===== ======= ===== #    1 0x582C46632FB388ABE5D178303... 7913.0000 84.5%   216 36.6343  1.57 SELECT MLModel?_ecgw_a_pred#    2 0x0E39F3F13EDA325B4E53D0244...  971.0000 10.4%    25 38.8400  2.04 INSERT slph_adjust_his#    3 0x3FC5160B3B25069FA843DC222...  466.0000  5.0%    12 38.8333  1.53 SELECT MLModel?_jd_pred unit_info MLModel?_jd_pred# MISC 0xMISC                           10.0000  0.1%     2  5.0000   0.0 <1 ITEMS>
# Query 1: 0 QPS, 0x concurrency, ID 0x582C46632FB388ABE5D178303E079908 at byte 420282# This item is included in the report because it matches --limit.# Scores: V/M = 1.57# Attribute    pct   total     min     max     avg     95%  stddev  median# ============ === ======= ======= ======= ======= ======= ======= =======# Count         84     216# Exec time     84   7913s     20s     57s     37s     49s      8s     35s# Lock time      0       0       0       0       0       0       0       0# Rows sent      0       0       0       0       0       0       0       0# Rows examine  79   1.48G   7.01M   7.02M   7.02M   6.94M       0   6.94M# Query size     1  47.02k     222     223  222.89  212.52       0  212.52# Time          84  39.21M 185.87k 185.87k 185.87k 185.87k       0 185.87k# String:# Hosts        172.31.39.23 (120/55%), 172.31.46.35 (36/16%)... 3 more# Users        root# Query_time distribution#   1us#  10us# 100us#   1ms#  10ms# 100ms#    1s#  10s+  ################################################################# Tables#    SHOW TABLE STATUS LIKE 'MLModel6_ecgw_a_pred'\G#    SHOW CREATE TABLE `MLModel6_ecgw_a_pred`\G# EXPLAIN /*!50100 PARTITIONS*/SELECT * FROM MLModel6_ecgw_a_pred                where  unitname = 395 and forecast48hr >= now()                 and forecast48hr < NOW() + INTERVAL 1 HOUR                 order by predTime desc                 limit 1\G
# Query 2: 0 QPS, 0x concurrency, ID 0x0E39F3F13EDA325B4E53D0244F2E9A23 at byte 210412..........................................
从上面我们可以看到排在第一位的 SQL 语句在本次分析中总的时间占比高达 84%,且单次调用耗时在 36 秒。接下来我们看看 SQL 语句的情况:
mysql> SELECT * FROM MLModel6_ecgw_a_pred    ->                 where  unitname = 395 and forecast48hr >= now()     ->                 and forecast48hr < NOW() + INTERVAL 1 HOUR     ->                 order by predTime desc     ->                 limit 1    -> ;Empty set (39.59 sec)mysql> explain SELECT * FROM MLModel6_ecgw_a_pred    ->                 where  unitname = 395 and forecast48hr >= now()    ->                 and forecast48hr < NOW() + INTERVAL 1 HOUR    ->                 order by predTime desc    ->                 limit 1;+----+-------------+----------------------+------------+-------+---------------+---------+---------+------+------+----------+----------------------------------+| id | select_type | table                | partitions | type  | possible_keys | key     | key_len | ref  | rows | filtered | Extra                            |+----+-------------+----------------------+------------+-------+---------------+---------+---------+------+------+----------+----------------------------------+|  1 | SIMPLE      | MLModel6_ecgw_a_pred | NULL       | index | idx_un        | idx_un1 | 15      | NULL |  325 |     0.03 | Using where; Backward index scan |+----+-------------+----------------------+------------+-------+---------------+---------+---------+------+------+----------+----------------------------------+1 row in set, 1 warning (0.02 sec)

mysql> show index from MLModel6_ecgw_a_pred;+----------------------+------------+----------+--------------+--------------+-----------+-------------+----------+--------+------+------------+---------+---------------+---------+------------+| Table                | Non_unique | Key_name | Seq_in_index | Column_name  | Collation | Cardinality | Sub_part | Packed | Null | Index_type | Comment | Index_comment | Visible | Expression |+----------------------+------------+----------+--------------+--------------+-----------+-------------+----------+--------+------+------------+---------+---------------+---------+------------+| MLModel6_ecgw_a_pred |          0 | PRIMARY  |            1 | id           | A         |     6899295 |     NULL |   NULL |      | BTREE      |         |               | YES     | NULL       || MLModel6_ecgw_a_pred |          1 | idx_un   |            1 | forecast48hr | A         |       60106 |     NULL |   NULL | YES  | BTREE      |         |               | YES     | NULL       || MLModel6_ecgw_a_pred |          1 | idx_un   |            2 | UNITNAME     | A         |      352164 |     NULL |   NULL | YES  | BTREE      |         |               | YES     | NULL       || MLModel6_ecgw_a_pred |          1 | idx_un1  |            1 | predTime     | A         |      112492 |     NULL |   NULL | YES  | BTREE      |         |               | YES     | NULL       || MLModel6_ecgw_a_pred |          1 | idx_un1  |            2 | UNITNAME     | A         |      162489 |     NULL |   NULL | YES  | BTREE      |         |               | YES     | NULL       |+----------------------+------------+----------+--------------+--------------+-----------+-------------+----------+--------+------+------------+---------+---------------+---------+------------+5 rows in set (0.10 sec)
mysql>
从上面我们不难看出,此 SQL 语句使用了错误的索引 idx_un1 ,实际上使用 idx_un 索引选择性会更好,执行效率会更高。
解决问题
强制此 SQL 语句使用正确的索引,不到 1 秒就执行完毕:
mysql> SELECT * FROM MLModel6_ecgw_a_pred force index(idx_un)    ->                 where  unitname = 395 and forecast48hr >= now()     ->                 and forecast48hr < NOW() + INTERVAL 1 HOUR     ->                 order by predTime desc     ->                 limit 1    -> ;Empty set (0.03 sec)
mysql>
后续就是具体的优化工作,至于是优化索引设置,还是去调整 SQL 语句,可以根据实际情况来进行即可。
总结
pt-query-digest 是一个针对 MySQL slow log 进行分析的工具,可以获得更友好、易读、更人性化的 SQL 性能汇总及分析报告;
RDS MySQL 由于是托管的数据库,我们可以使用 awscli RDS API 或者以 MySQL sql 脚本来分别将 FILE 和 TABLE 形式的慢查询日志获取到本地,然后再使用 pt-query-digest 进行分析;
Percona Toolkit 是业界比较知名的 MySQL 工具集,里面包含多种可以提升效率的管理工具,除了 pt-query-digest 使用较多之外,还有 pt-online-schema-change 、 pt-mysql-summary 、 pt-summary 等工具被广泛使用,推荐有兴趣的同学可以尝试使用;
作者介绍:
闫静
AWS 专业服务团队咨询顾问、云架构师。具有 10 年以上大型数据库维护管理及架构设计经验,目前主要专注于企业客户数据库上云、整体上云架构方面的规划/设计及实施。热衷于云基础架构规划、云端数据库架构设计、大数据架构部署等领域的研究和学习。
本文转载自 AWS 技术博客。
原文链接:
https://amazonaws-china.com/cn/blogs/china/pt-query-digest-rds-mysql-slow-searchnew/
更多内容推荐
C 语言中奇妙又有趣的符号——C 语言运算(操作)符
C语言运算符是说明特定操作的符号 ,所以它也被称作为操作符,它是构造C语言表达式的工具 。C语言的运算异常丰富,除了控制语句和输入输出以外的几乎所有的基本操作都为运算符处理。
2022-06-19
《MySQL 自传》
撰写本文查阅了大量参考资料,也得到很多朋友的指点帮助,特别感谢:
2022-09-05
Facebook 的 MySQL 8.0 迁移之路
我们很清楚,迁移到 8.0 会比迁移到 5.6 或 MyRocks 更加困难。
6. 集成测试:起步与 MySQL 的增删改查
2023-09-26
有赞 MySQL 自动化运维系统—— ZanDB
本文出自《有赞技术2018年度合集》系列
如何使用 JDBC API 操作数据库
1、使用JDBC API操作数据库的基本步骤分析使用JDBC API操作数据库,进行CRUD基本步骤都相似。加载和注册驱动获取数据库连接准备操作执行SQL的Statement对象执行SQL调用Statement对象的executeUpdate(String sql)执行SQL语句进行插入、修改、删除操作调用Stat
2022-01-06
面渣逆袭:MySQL 六十六问,两万字 + 五十图详解
大家好,我是三鸽,这期继续更新面渣逆袭系列,主角是MySQL。
2022-08-04
3、MySQL 日志文件与数据文件详解
2023-09-27
Amazon Detective – 快速安全性调查和分析
宣布此服务已对所有 AWS 客户开放。
性能达到自建库 3 倍!华为云 RDS for MySQL 测评解读
华为云RDS for MySQL得益于在读写性能、扩容能力、备份恢复功能、故障容忍能力方面的显著优化提升,更是广受市场欢迎。
在线 SQL(Insert/Update) 语句转 JSON 工具
在线SQL(Insert/Update)语句转JSON工具
2021-09-21
8. Redis 分布式锁:singleflight 优化、面试要点与总结
2023-09-27
推荐几款 MySQL 相关工具
本篇文章主要介绍 SQL 审核、binlog 解析、Percona Toolkit 几类工具。感兴趣的同学可以安装学习下,好的工具能让工作事半功倍。
2020-11-26
21|数据库 ORM 对象关系映射(一):数据库连接与必备操作
这节课,我们一起来学习在线视频平台的数据管理基石——数据库。
2023-06-09
mysqldump 备份技巧分享
mysqldump 是日常比较常用的一个工具了,在对数据库进行导出工作时,经常会用到 mysqldump 。本篇文章将介绍 mysqldump 工具的使用方法并分享几点备份技巧。
2021-07-19
在线 TSV 转 HTMLTable 工具
在线TSV转HTMLTable工具
2022-05-08
1、使用分布式缓存 Redis
2023-09-26
在线 EXCEL 文件数据转换解析工具
在线EXCEL文件数据转换解析工具
2021-10-14
5. SELECT:Beego、GORM、Ent 的 SQL 构造分析
2023-09-26
解析 CloudQuery 审计分析功能
数据库管理工具审计分析核心价值是为数据库安全事件追责、定责提供依据,与此同时也可以对数据库的攻击和非法操作等行为起到震慑作用。且数据库自身携带的审计功能会拖慢数据库的性能,而通过数据库管理工具则可以有效避免这个问题。
2020-10-22

暂无签名
推荐阅读
电子书

大厂实战PPT下载
换一换 
赵缙翔 | 快手 前端工程师
赵振阳 | 深信服 研发架构师
邹弘宇 | 腾讯云 异构计算 & THPC 高级产品经理


评论