
作为开发者,我们工作 70% 的时间都用于调试。20% 用于架构设计和团队沟通,仅有 10% 的时间用于写代码。
调试好比犯罪电影中同时扮演罪犯和侦探的角色。
— Filipe Fortes via Twitter
因此如何让这 70% 的时间变得高效显得尤为重要。LLDB 是个很好的选择。尽管 Xcode 拥有功能完善的调试面板,控制台仍然是调试中重要的组成部分。接下来我会探讨一些工作中常用到的一些 LLDB 调试技巧。
从哪开始?
LLDB 拥有大量有用的调试工具。我会选一些重要的命令讨论:
- 获取变量值:
expression,e,print,po,p - 获取执行环境 + 特定语言命令:
bugreport,frame,language - 执行流程控制:
process,breakpoint,thread,watchpoint - 其他:
command,platform,gui
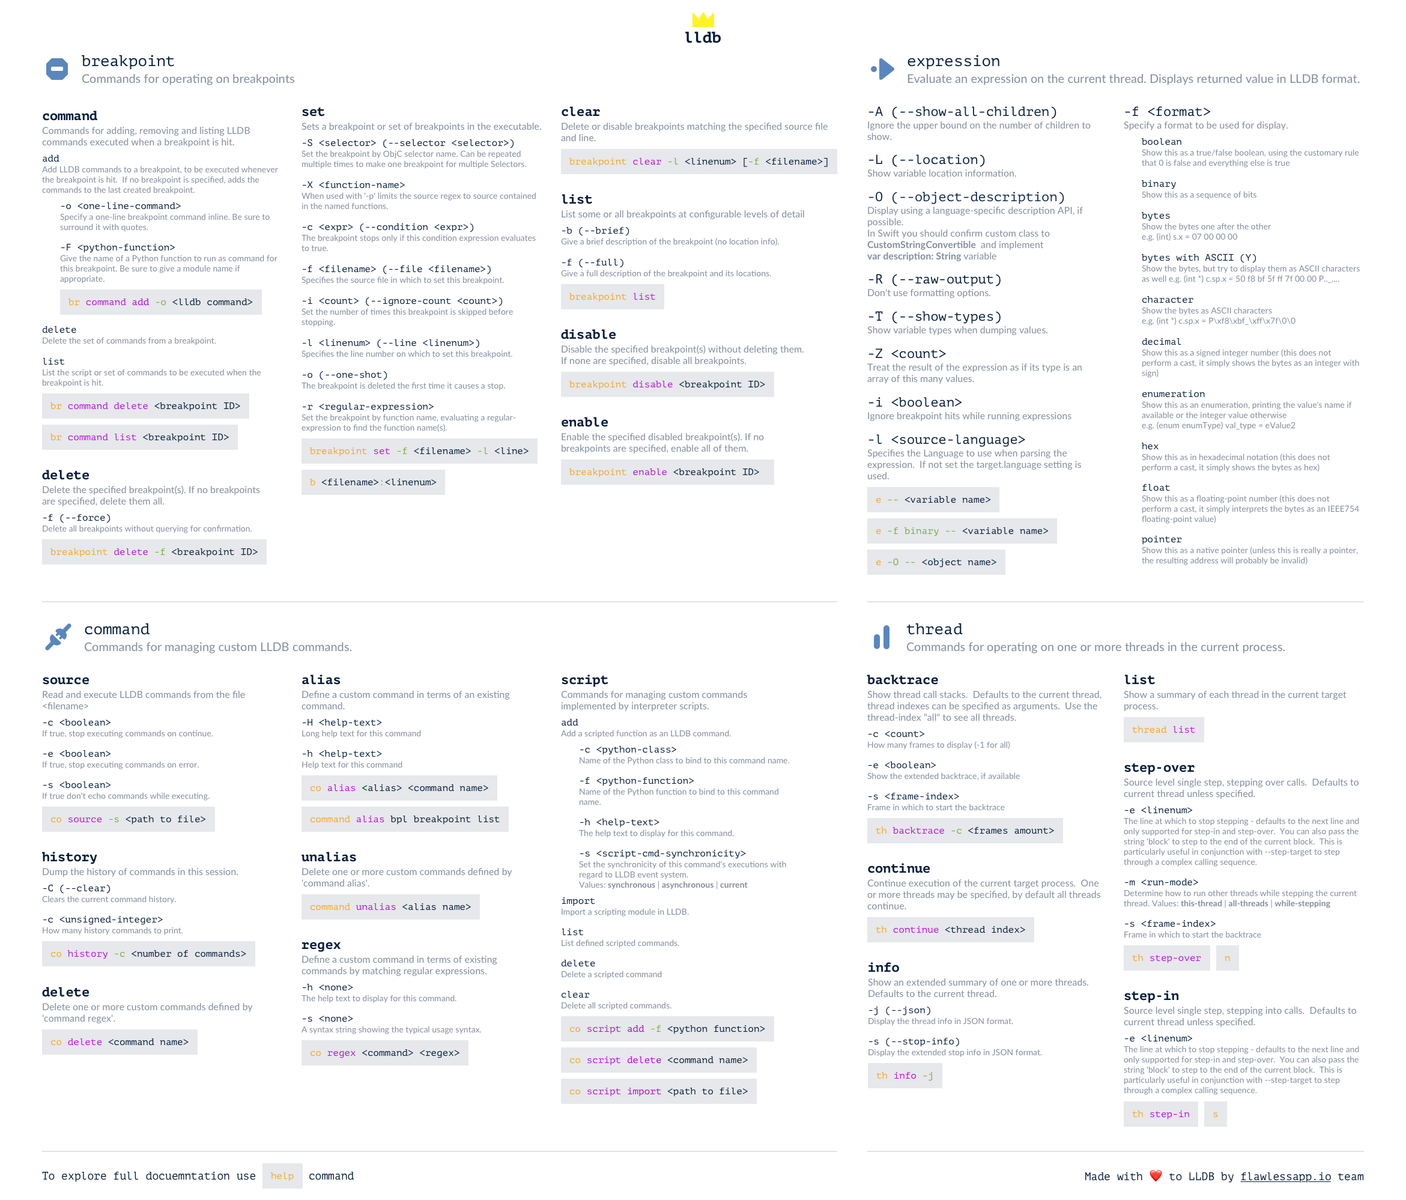
下面列出了 LLDB 常用命令的描述和例子。你可以保存该图片方便以后查阅。
1. 获取变量值和状态
命令:expression,e,print,po,p
调试工具最基本的功能是打印和修改变量的值。expression或e就是这样的工具。你可以在运行时执行几乎任何表达式或命令。
假设你正在调试valueOfLifeWithoutSumOf()方法,该方法用于两数相加并与 42 相减。
现在运行得到了错误的结果。你可以像下图这样修改代码尝试定位问题:
更好的方式是使用 expression 命令在运行时修改变量的值。设置断点并运行。
按照 LLDB 格式打印变量的值:
(lldb) e <variable>
完全相似的方式执行表达式:
(lldb) e <expression>
(lldb) e sum (Int) $R0 = 6 // 当前调试会话中可以使用 $R0 代替该变量 (lldb) e sum = 4 // 修改 sum 变量的值 (lldb) e sum (Int) $R2 = 4 // 调试期间 sum 值变为 4
``expression命令有一些选项。LLDB 使用双破折号–分隔选项和表达式:
(lldb) expression <some flags> -- <variable>
expression拥有大约 30 个选项。这些选择都值得你来探索。终端输入以下命令可以获取详细的文档:
> lldb > (lldb) help # To explore all available commands > (lldb) help expression # To explore all expressions related sub-commands
下面列出了几个比较常用的选项:
-D <count>(--depth <count>) - 设置打印聚合类型的递归深度(默认无限递归)。-O(--object-desctiption) - 打印 description 方法。-T(--show-types) - 显示每个变量的类型。-f <format>(--format<format>) - 设置输出格式。-i <boolean>(--ignore-breakpoints <boolean>) - 运行表达式时忽略表达式内的断点。
假如现在有个 logger 对象。该对象拥有一些字符串和结构体作为属性。如果只想打印层级 1 的属性,可使用 -D 选项:
(lldb) e -D 1 -- logger (LLDB_Debugger_Exploration.Logger) $R5 = 0x0000608000087e90 { currentClassName = "ViewController" debuggerStruct ={...} }
LLDB 默认会递归打印对象的所有属性,展示非常详尽的内容:
(lldb) e -- logger (LLDB_Debugger_Exploration.Logger) $R6 = 0x0000608000087e90 { currentClassName = "ViewController" debuggerStruct = (methodName = "name", lineNumber = 2, commandCounter = 23) }
也可以像如下使用 e -O --或者别名 po来打印:
(lldb) po logger <Logger: 0x608000087e90>
这样直接打印可读性不高。通过实现 CustomStringConvertible协议中的var description: String { return ...}属性,po会返回可读性更好的描述。
在这段开头也提到了print命令。除了print命令没有可用选项无需传递参数外,print <expression/variable>和expression --<expression/variable>几乎一样。
2. 获取执行环境 + 特定语言命令
bugreport,frame,language
你是否经常需要拷贝粘贴日志到任务管理器中来定位问题。LLDB 的bugreport命令可以生成一份详细的 app 当前状态的报告。该命令对于想要延迟追踪定位问题非常有用。为了保存 app 的状态,你可以使用bugreport来生成报告。
(lldb) bugreport unwind --outfile <path to output file>
生成的报告如下:
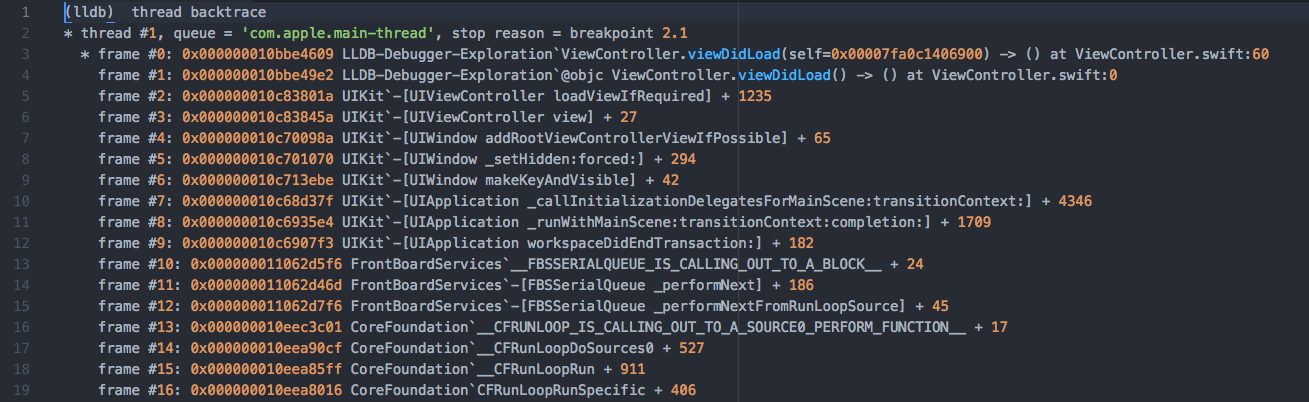
frame命令可以打印出当前线程的栈帧:
使用如下命令来快速了解你在哪和当前执行环境:
(lldb) frame info frame #0: 0x000000010bbe4b4d LLDB-Debugger-Exploration`ViewController.valueOfLifeWithoutSumOf(a=2, b=2, self=0x00007fa0c1406900) -> Int at ViewController.swift:96
该信息对文章后面提到的断点管理非常有用。
LLDB 有一些针对特定语言的命令。这些命令有针对 C++,Objective-C,Swift 和 RenderScript 的。这篇文章中只讨论针对 swift 的两个命令:demangle和refcount。
demangle命令正如其名字描述的一样用于修复损坏的 Swift 类型名 (编译期间为避免命名空间问题而产生)。想要了解更多可以观看 WWDC14 session - “Advanced Swift Debugging in LLDB”
refcount命令的命名也非常直观,可用于显示对象的引用计数。让我们回到前面讨论过的用于输出的对象 - logger:
(lldb) language swift refcount logger refcount data: (strong = 4, weak = 0)
这对于调试查找内存泄露问题是很有帮助的。
3. 执行流程控制
process,breakpoint,thread
这是我最喜欢的部分。使用 LLDB 的这些命令 (尤其是breakpoint) 可以让调试变得更自动化。有助于提升调试速度。
process用于控制要调试的进程,可把 LLDB 依附到特定 target 或从 target 上解绑。运行 target 时 Xcode 已经为我们做好了将 LLDB 依附到该进程的工作,所以这里不再讨论 LLDB 的依附。可通过阅读苹果手册 -"Using LLDB as a Standalone Debugger"来了解如何依附LLDB 到进程中。
process status用于打印当前进程及断点处的相关信息:
(lldb) process status Process 27408 stopped * thread #1, queue = 'com.apple.main-thread', stop reason = step over frame #0: 0x000000010bbe4889 LLDB-Debugger-Exploration`ViewController.viewDidLoad(self=0x00007fa0c1406900) -> () at ViewController.swift:69 66 67 let a = 2, b = 2 68 let result = valueOfLifeWithoutSumOf(a, and: b) -> 69 print(result) 70 71 72
使用如下命令可继续执行:
(lldb) process continue (lldb) c // 等同于上面命令
这等同于 Xcode 调试面板中 “continue” 按钮:
breakpoint用于断点的各种操作。这里不会讨论这些太常见的命令:breakpoint enable,breakpoint disable,和breakpoint delete。
使用list子命令可以打印出所有断点:
(lldb) breakpoint list Current breakpoints: 1: file = '/Users/Ahmed/Desktop/Recent/LLDB-Debugger-Exploration/LLDB-Debugger-Exploration/ViewController.swift', line = 95, exact_match = 0, locations = 1, resolved = 1, hit count = 1 1.1: where = LLDB-Debugger-Exploration`LLDB_Debugger_Exploration.ViewController.valueOfLifeWithoutSumOf (Swift.Int, and : Swift.Int) -> Swift.Int + 27 at ViewController.swift:95, address = 0x0000000107f3eb3b, resolved, hit count = 1 2: file = '/Users/Ahmed/Desktop/Recent/LLDB-Debugger-Exploration/LLDB-Debugger-Exploration/ViewController.swift', line = 60, exact_match = 0, locations = 1, resolved = 1, hit count = 1 2.1: where = LLDB-Debugger-Exploration`LLDB_Debugger_Exploration.ViewController.viewDidLoad () -> () + 521 at ViewController.swift:60, address = 0x0000000107f3e609, resolved, hit count = 1
列表中的第一个数字是断点 ID,可用于引用对应的断点。下面从控制台设置一个新的断点:
(lldb) breakpoint set -f ViewController.swift -l 96 Breakpoint 3: where = LLDB-Debugger-Exploration`LLDB_Debugger_Exploration.ViewController.valueOfLifeWithoutSumOf (Swift.Int, and : Swift.Int) -> Swift.Int + 45 at ViewController.swift:96, address = 0x0000000107f3eb4d
上面例子中-f选项用于指明断点所在的文件。-l选项用于指明断点所在的行数。对于上面例子有个更简洁的表达:
(lldb) b ViewController.swift:96
也可以使用以命令对某个方法设置断点:
(lldb) breakpoint set --one-shot -f ViewController.swift -l 90 (lldb) br s -o -f ViewController.swift -l 91 // 上面命令的精简版
有时候需要断点仅命中一次。命中后随即删除该断点。通过如下命令行可以实现:
(lldb) breakpoint set --one-shot -f ViewController.swift -l 90 (lldb) br s -o -f ViewController.swift -l 91 // 上面命令的精简版
下面进入最有趣的部分 - 断点自动化。你知道可以设置特定动作用于断点发生时执行吗?调试时你是否喜欢在代码中使用print()来打印你感兴趣的值?下面有个更好的方法。
通过breakpoint command可以设置命中断点后执行的命令。甚至可以设置不会打断执行的"透明"断点。从技术上来说"透明"断点已然会打断执行,但通过在命令链中添加continue命令可以变得无感知。
(lldb) b ViewController.swift:96 // 设置断点 Breakpoint 2: where = LLDB-Debugger-Exploration`LLDB_Debugger_Exploration.ViewController.valueOfLifeWithoutSumOf (Swift.Int, and : Swift.Int) -> Swift.Int + 45 at ViewController.swift:96, address = 0x000000010c555b4d (lldb) breakpoint command add 2 // Setup some commands Enter your debugger command(s). Type 'DONE' to end. > p sum // Print value of "sum" variable > p a + b // Evaluate a + b > DONE
通过breakpoint command list <breakpoint id>命令可以检查一遍命令是否都正确:
(lldb) breakpoint command list 2 Breakpoint 2: Breakpoint commands: p sum p a + b
当断点命中时控制台会有如下输出:
Process 36612 resuming p sum (Int) $R0 = 6 p a + b (Int) $R1 = 4
这正是我们所期望的。甚至可以在命令链的后面添加continue来防止执行被打断。
(lldb) breakpoint command add 2 // Setup some commands Enter your debugger command(s). Type 'DONE' to end. > p sum // Print value of "sum" variable > p a + b // Evaluate a + b > continue // Resume right after first hit > DONE
输出结果:
p sum (Int) $R0 = 6 p a + b (Int) $R1 = 4 continue Process 36863 resuming Command #3 'continue' continued the target.
通过thread和其子命令可以完全的控制执行流程:step-over,step-in,step-out,continue。这些命令等同于 Xcode 调试面板里用于控制执行流程的按钮。
对于这些命令也有预定义的快捷命令:
(lldb) thread step-over (lldb) next // 等同于 "thread step-over" (lldb) n // 等同于 "next" (lldb) thread step-in (lldb) step // 等同于 "thread step-in" (lldb) s // 等同于 "step"
通过info子命令可获取关于当前线程的更多信息:
(lldb) thread info thread #1: tid = 0x17de17, 0x0000000109429a90 LLDB-Debugger-Exploration`ViewController.sumOf(a=2, b=2, self=0x00007fe775507390) -> Int at ViewController.swift:90, queue = 'com.apple.main-thread', stop reason = step i
list子命令用于显示当前所有活跃线程:
(lldb) thread list Process 50693 stopped * thread #1: tid = 0x17de17, 0x0000000109429a90 LLDB-Debugger-Exploration`ViewController.sumOf(a=2, b=2, self=0x00007fe775507390) -> Int at ViewController.swift:90, queue = 'com.apple.main-thread', stop reason = step in thread #2: tid = 0x17df4a, 0x000000010daa4dc6 libsystem_kernel.dylib`kevent_qos + 10, queue = 'com.apple.libdispatch-manager' thread #3: tid = 0x17df4b, 0x000000010daa444e libsystem_kernel.dylib`__workq_kernreturn + 10 thread #5: tid = 0x17df4e, 0x000000010da9c34a libsystem_kernel.dylib`mach_msg_trap + 10, name = 'com.apple.uikit.eventfetch-thread'
其他
command,platform,gui
LLDB 中有一个用于管理其他命令的命令。听起来很奇怪,但非常有用。首先,该命令允许你从文件执行 LLDB 命令。因此你可以创建一个包含大量有用命令的脚本当做一个命令来执行。下面是一个包含两条命令的文件:
thread info // 显示当前线程信息 br list // 显示所有断点
真正命令执行如下:
(lldb) command source /Users/Ahmed/Desktop/lldb-test-script Executing commands in '/Users/Ahmed/Desktop/lldb-test-script'. thread info thread #1: tid = 0x17de17, 0x0000000109429a90 LLDB-Debugger-Exploration`ViewController.sumOf(a=2, b=2, self=0x00007fe775507390) -> Int at ViewController.swift:90, queue = 'com.apple.main-thread', stop reason = step in br list Current breakpoints: 1: file = '/Users/Ahmed/Desktop/Recent/LLDB-Debugger-Exploration/LLDB-Debugger-Exploration/ViewController.swift', line = 60, exact_match = 0, locations = 1, resolved = 1, hit count = 0 1.1: where = LLDB-Debugger-Exploration`LLDB_Debugger_Exploration.ViewController.viewDidLoad () -> () + 521 at ViewController.swift:60, address = 0x0000000109429609, resolved, hit count = 0
不幸的是,无法在执行脚本文件时传递参数(除非在脚本文件中创建一个可用变量)。
script子命令提供了一些高级用法,可用于管理(add,delete,import,list)自定义的 Python 脚本。script是的命令自动化变成了可能。更详尽的信息请查阅 Python scripting for LLDB 指南。示例中,我们创建了一个功能非常简单的 script.py 脚本,该脚本仅包含了 print_hello() 命令用于打印"Hello Debug 个!"到控制台:
import lldb def print_hello(debugger, command, result, internal_dict): print "Hello Debugger!" def __lldb_init_module(debugger, internal_dict): debugger.HandleCommand('command script add -f script.print_hello print_hello') // Handle script initialization and add command from this module print 'The "print_hello" python command has been installed and is ready for use.' // Print confirmation that everything works
接下来需要导入该 Python 脚本,导入后可直接使用脚本命令:
(lldb) command import ~/Desktop/script.py The "print_hello" python command has been installed and is ready for use. (lldb) print_hello Hello Debugger!
status子命令可用于快速查看当前平台信息。status会打印出:SDK 路径,处理器架构,操作系统版本和该 SDK 支持的可用设备列表。
(lldb) platform status Platform: ios-simulator Triple: x86_64-apple-macosx OS Version: 10.12.5 (16F73) Kernel: Darwin Kernel Version 16.6.0: Fri Apr 14 16:21:16 PDT 2017; root:xnu-3789.60.24~6/RELEASE_X86_64 Hostname: 127.0.0.1 WorkingDir: / SDK Path: "/Applications/Xcode.app/Contents/Developer/Platforms/iPhoneSimulator.platform/Developer/SDKs/iPhoneSimulator.sdk" Available devices: 614F8701-3D93-4B43-AE86-46A42FEB905A: iPhone 4s CD516CF7-2AE7-4127-92DF-F536FE56BA22: iPhone 5 0D76F30F-2332-4E0C-9F00-B86F009D59A3: iPhone 5s 3084003F-7626-462A-825B-193E6E5B9AA7: iPhone 6 ...
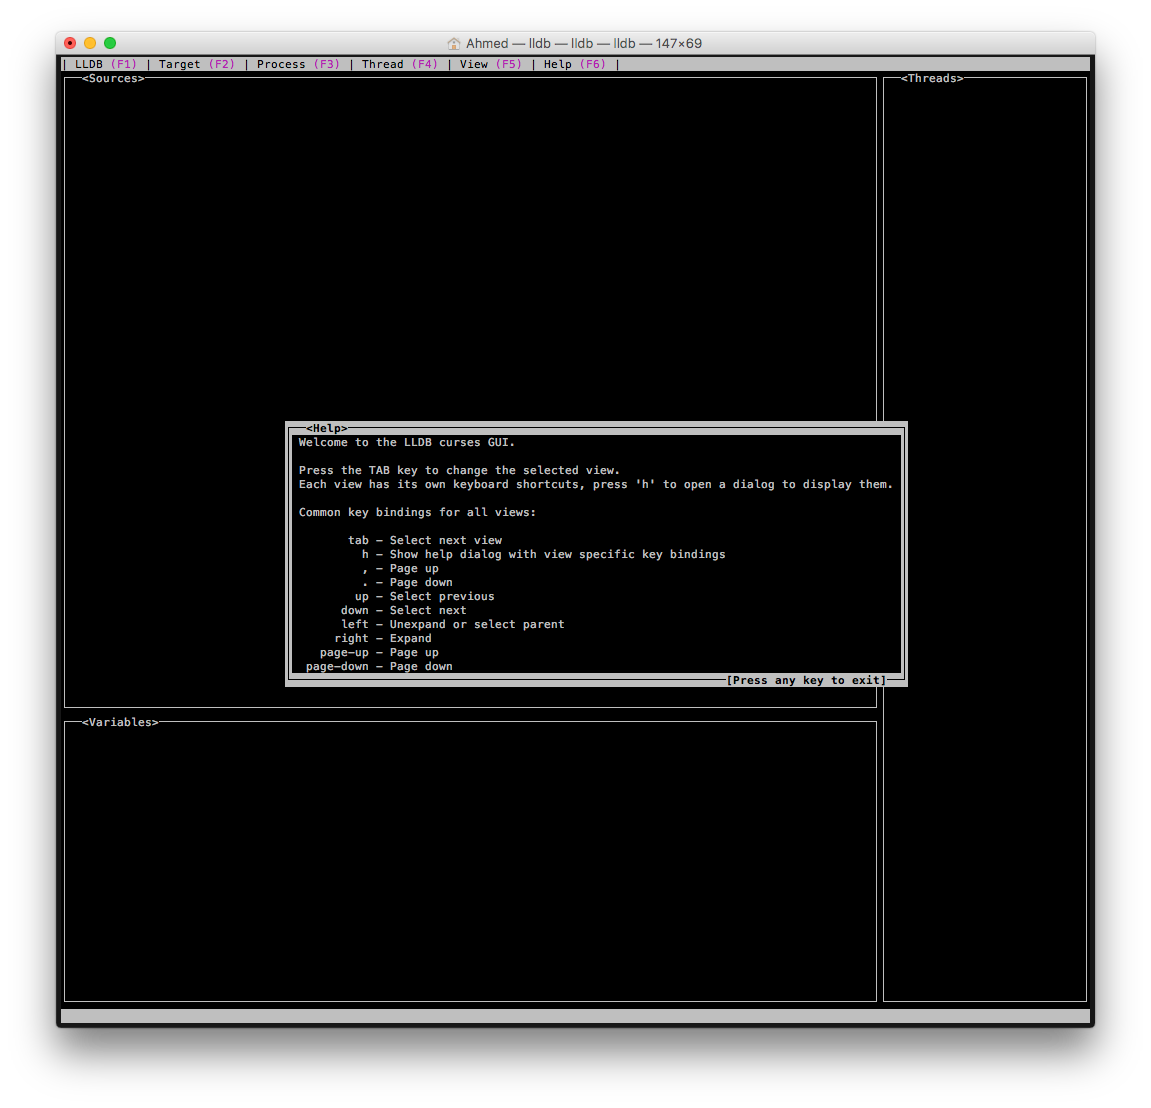
Xcode 中无法使用 LLDB 的可视化模式,但可以在终端中使用。
(lldb) gui // 在 Xcode 中执行 gui 命令会报错:该命令只能在无交互的终端执行
结论
这篇文章大致描绘出了 LLDB 的强大。尽管 LLDB 存在于我们的开发环境中,但大多数人并没有发掘出它的能量。希望这篇关于 LLDB 基本功能和自动化调试的概览能对大家有所帮助。
文章遗漏了 LLDB 的很多功能。像可视调试技巧就没有提到。如果你对这样的主题感兴趣,请在下面的评论中留言。能写一些大家感兴趣的东西很高兴。
鼓励你打开终端,开启 LLLDB,输入help 。很详细的文档会呈现出来。尽管这是一个很耗时的过程,但仍然期望你能花时间去阅读这个文档。只有精通你的生产工具才能变得真正的高效。
参考
- Official LLDB site — you’ll find here all possible materials related to LLDB. Documentation, guides, tutorials, sources and much more.
- LLDB Quick Start Guide by Apple — as usual, Apple has a great documentation. This guide will help you to get started with LLDB really quickly. Also, they’ve described how to do debugging with LLDB without Xcode
- How debuggers work: Part 1 — Basics — I enjoyed this series of articles a lot. It’s Just fantastic overview how debuggers really work. Article describes all underlying principles using code of hand-made debugger written in C. I strongly encourage you to read all parts of these great series ( Part 2 , Part 3 ).
- WWDC14 Advanced Swift Debugging in LLDB — great overview what’s new in LLDB in terms of Swift debugging. And how LLDB helps you be more productive with an overall debugging process using built-in functions and features.
- Introduction To LLDB Python Scripting — the guide on Python scripting for LLDB which allows you to start really quickly.
- Dancing in the Debugger. A Waltz with LLDB — a clever introduction to some LLDB basics. Some information is a bit outdated (like (lldb) thread return command, for example. Unfortunately, it doesn’t work with Swift properly because it can potentially bring some damage to reference counting). Still, it’s a great article to start your LLDB journey.
查看英文原文: Debugging Swift code with LLDB
感谢覃云对本文的审校。
给InfoQ 中文站投稿或者参与内容翻译工作,请邮件至 editors@cn.infoq.com 。也欢迎大家通过新浪微博( @InfoQ , @丁晓昀),微信(微信号: InfoQChina )关注我们。

腾讯大规模云原生技术实践案例集
本案例集详细阐释了 QQ、腾讯会议、和平精英、小红书、斗鱼、微盟等十多个亿级用户产品背后的大规模云原生...


评论